Ride-hailing, delivery, and logistics platforms are all two-sided marketplaces — you serve two completely different customer types at once: supply (drivers/couriers) and demand (riders/users). A traditional single-sided business only has to optimize one conversion funnel, but in a two-sided marketplace the two sides constantly influence — and sometimes fight — each other. This article uses a ride-hailing/delivery platform to walk through how to build an analytics framework that genuinely serves both sides.
Note: all figures in this article are hypothetical, used only to illustrate the analytical approach — not actual operating data from any specific company.
What Is a Two-Sided Marketplace?
A two-sided marketplace is a platform whose value comes from connecting two groups that need each other. The platform itself doesn't produce supply — it matches it.
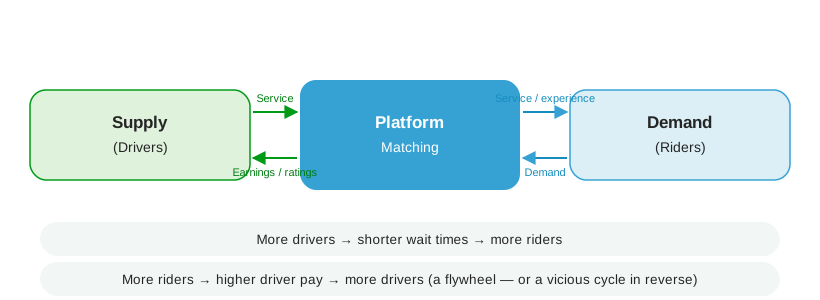
Two-Sided Marketplace vs. Single-Sided Business
| Dimension | Single-sided (e.g. e-commerce) | Two-sided (e.g. ride-hailing) |
|---|---|---|
| Optimization target | One conversion funnel | Two funnels that influence each other |
| Core metrics | Conversion rate, AOV | Match rate, wait time, driver utilization |
| Pricing logic | Price one customer segment | Dynamic pricing that moves both sides at once |
| Cold-start difficulty | Moderate | High (chicken-and-egg: no drivers means no riders, no riders means no drivers) |
| Geographic sensitivity | Lower | Very high (supply and demand shift block by block within a city) |
In practice: a data team on a two-sided marketplace is accountable for both sides' data at once. Any analysis that only looks at one side risks recommending decisions that damage the whole ecosystem.
Why Is This Problem Especially Hard?
Take a typical ride-hailing/delivery platform:
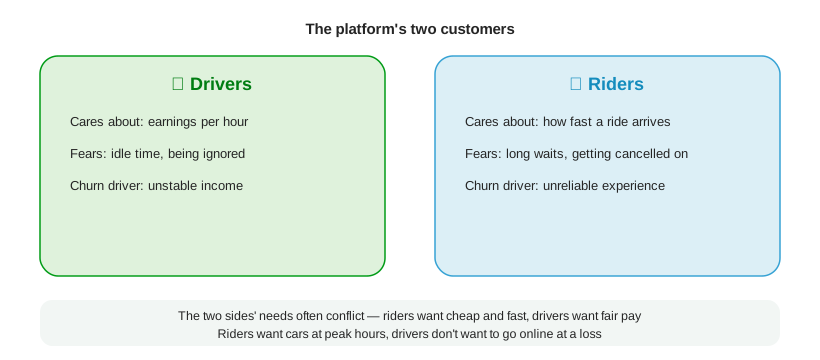
A team that only watches rider satisfaction may keep cutting prices and adding subsidies until driver earnings get squeezed, supply shrinks, and rider wait times actually get worse. Conversely, a team that only watches driver earnings may price too high, lose riders, see order volume drop — and driver earnings fall too, since there's less demand to serve. There is no single-sided optimum in a two-sided marketplace, only a dynamic balance.
Step 1: Build a Dual-Sided Metrics Framework
The first step in analyzing a two-sided marketplace is refusing to collapse the problem into one "North Star metric" — you need at least two parallel sets of metrics.
Core Driver-Side Metrics
| Metric | Definition | Why it matters |
|---|---|---|
| Online hours | Time a driver spends online per day/week | Reflects total supply |
| Utilization rate | Time on trip ÷ time online | Too low → drivers feel they're wasting time |
| Acceptance rate | Orders accepted ÷ orders offered | Low rate signals unattractive order quality or routing |
| Earnings per online hour | Total earnings ÷ hours online | The core driver of driver retention |
| Deadhead distance | Unpaid distance driven to reach a pickup | Affects a driver's real hourly rate and satisfaction |
| Driver churn | Share of drivers who stop going online in a period | A leading indicator, usually appearing before a visible supply shortage |
Core Rider-Side Metrics
| Metric | Definition | Why it matters |
|---|---|---|
| Wait time / ETA | Time from request to driver arrival | The single most rider-sensitive experience metric |
| Match rate | Requests successfully matched ÷ total requests | Reflects whether supply is sufficient |
| Cancellation rate | Share of orders cancelled by rider or driver | "Rider-cancelled" and "driver-cancelled" mean very different things — split them |
| Completion rate | Completed orders ÷ orders created | A composite experience metric |
| Repeat rate | Share of riders who order again within a period | The core signal for long-term retention |
| Price sensitivity | Elasticity of demand to price changes | Determines how much room dynamic pricing has to work with |
Key principle: every time you adjust a policy on either side — subsidies, dispatch logic, pricing — check both sets of metrics, not just the side you meant to optimize.
Step 2: Understand Marketplace Liquidity
The single most important underlying concept in a two-sided marketplace is liquidity — whether supply and demand can be effectively matched at the right time and place.
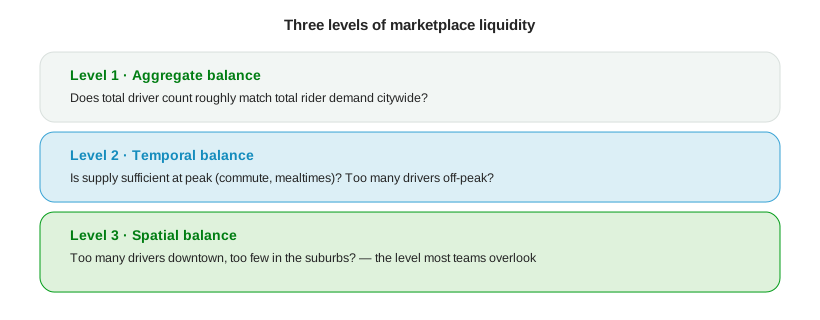
Most teams only look at Level 1 (citywide aggregate supply/demand ratio), but what actually drives rider experience is usually Level 3 — even when a city's total driver count looks adequate, a specific zone at a specific hour can still have no cars available.
Finding Supply Gaps with a Heatmap
Split the city into a grid (e.g. 500m x 500m) and compute for each cell:
Supply gap score = demand density (orders/hour) − supply density (online drivers)

Score > 0  → supply shortfall, rider wait time will grow
Score ≈ 0  → supply and demand balanced
Score < 0  → driver oversupply, driver utilization will drop
This gridded analysis is the data foundation for downstream dynamic pricing and driver-repositioning incentive design.
Step 3: Break Down the Two Parallel Funnels to Find Friction
A two-sided marketplace actually has two parallel funnels — a bottleneck in either one hurts the overall experience.
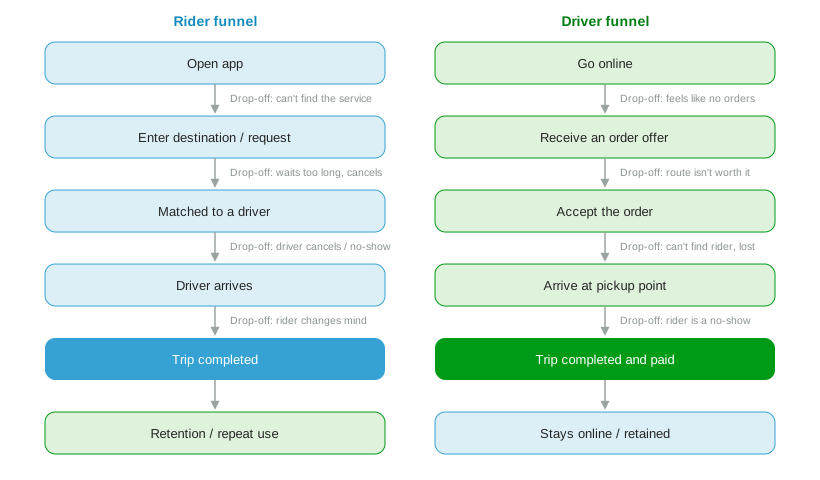
Lay the two funnels side by side and you'll often find that a "rider drop-off" actually originates on the driver side (e.g. a high decline rate slows down matching), and vice versa. Analyzing a single funnel alone only ever shows you the symptom, never the root cause.
Common Cross-Side Cause-and-Effect Patterns
| Observed symptom (rider side) | Common root cause (driver side) |
|---|---|
| Wait times spike during peak hours | Driver online rate drops during peak (not worth it, or already off shift) |
| High cancellation rate in a specific area | Low driver willingness to accept in that area (safety, road conditions, parking) |
| Short trips match slowly | Drivers tend to decline short trips (per-trip earnings below the deadhead cost) |
| Poor service quality late at night | Sparse driver supply overnight, remaining drivers cherry-pick more aggressively |
Step 4: Segment Both Sides
Just like a single-sided business, a two-sided marketplace needs segmentation — except you build personas for both sides.
Example Driver Segments
| Persona | Traits | Strategy |
|---|---|---|
| 🚗 Full-time stable | Online 8hr+ daily | Income stability |
| ⏰ Peak-hour driver | Only online during commute/mealtimes | Peak-hour incentive boost |
| 🎯 Cherry-picker | Low acceptance rate, only takes long trips | Review dispatch algorithm |
| 🌱 New driver | Online < 30 days | Onboarding + earnings floor |
| ⚠️ At risk of churn | Online hours steadily declining | Proactive outreach |
Example Rider Segments
| Persona | Traits | Strategy |
|---|---|---|
| 🏆 Frequent commuter | Fixed time, fixed route | Subscription / pass plans |
| 🎉 Flexible off-peak | High tolerance for wait time | Off-peak diversion offers |
| 💸 Price-sensitive | Heavily promo-driven | Targeted coupons to avoid overuse |
| 😤 High cancel risk | Historically high cancellation rate | Pre-order confirmation |
| 🌟 High-value long-distance | High AOV, quality-sensitive | Priority match, quality guarantee |
Once segmented, driver-side and rider-side strategies must be cross-referenced: for example, routing "flexible off-peak riders" toward off-peak hours is exactly what's needed to absorb the capacity of "idle off-peak drivers." That intersection is the real value of two-sided marketplace analysis — not optimizing each side separately, but finding where the two sides can reinforce each other.
Step 5: Data Considerations for Dynamic Pricing and Incentive Design
Dynamic (surge) pricing is often misunderstood as a pure revenue lever, but its real function is real-time supply-demand adjustment.
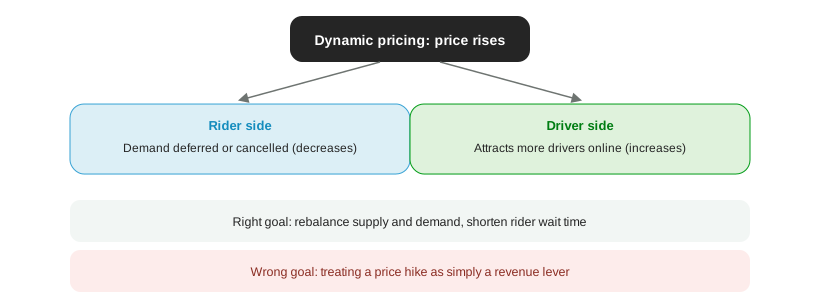
Guardrail Metrics to Watch When Designing Dynamic Pricing Experiments
| Guardrail metric | Why watch it |
|---|---|
| Rider complaint rate | Excessive price hikes show up directly in complaints |
| Order cancellation rate | A spike in cancellations from a price hike signals the pricing went too far |
| Net driver increase | Confirms the hike genuinely attracted extra supply, not just extra revenue |
| Long-term retention (both sides) | Short-term revenue gains shouldn't come at the cost of either side's long-term retention |
Driver-side incentive design (bonuses, quest-based rewards) follows the same logic: any subsidy policy must be checked for whether it truly increased net supply, rather than just paying drivers who would have gone online anyway.
Step 6: Build a Two-Sided Monitoring Dashboard
A two-sided marketplace's operating dashboard should have at least three layers:
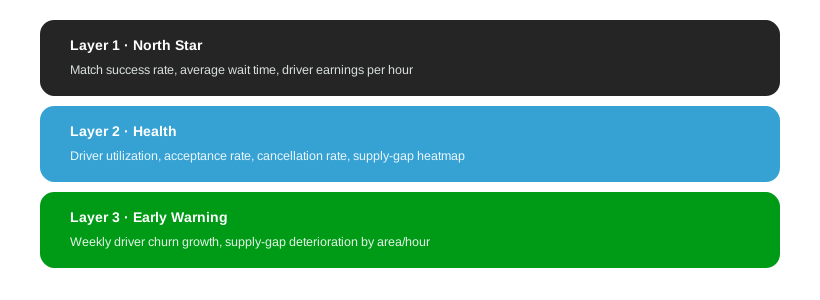
Layer 3's early-warning metrics are the ones most often neglected — but they're usually the key to preventing supply collapse. Driver churn typically leads visible symptoms by one to two weeks; by the time rider wait times noticeably worsen, the best window to intervene has usually already passed.
Common Pitfalls
1. Optimizing Only One Side
Marketing watches rider conversion, ops watches driver supply — the two metric sets never appear on the same report for discussion.
→ Fix: build a joint two-sided dashboard, and require every policy change to come with an impact assessment on both sides.
2. Treating a City as a Single Market
Downtown and suburban supply-demand structures are completely different; applying the same pricing or incentive logic to both is suboptimal for either.
→ Fix: build regional supply-demand models at the grid or district level.
3. Ignoring Non-Monetary Driver Factors
Driver churn isn't only about insufficient earnings — road conditions, parking, safety perception, and app usability all matter, but are often missing from the data collection plan.
→ Fix: pair regular qualitative interviews with quantitative metrics to close the data gap.
4. Treating Subsidies as a Universal Fix
Throwing bonuses at every supply shortage without verifying whether the bonus generated additional supply, versus just inflating the cost of drivers who would have gone online regardless.
→ Fix: use a difference-in-differences design (treatment vs. control) to validate the marginal impact of subsidies.
5. Ignoring the Time Lag Between the Two Sides
After a driver-side policy change, the supply response usually takes days to weeks to show up in rider-side experience — drawing conclusions too quickly leads to misjudgment.
→ Fix: set a reasonable observation window and distinguish short-term noise from a real trend.
6. Applying Mature-Market Assumptions to a Cold-Start Market
When a new city first launches, both drivers and riders are scarce, and the supply-demand dynamics are completely different from a mature market — forcing the same model onto it will misdiagnose the problem.
→ Fix: use a dedicated minimal-viable metric set for the cold-start phase instead of forcing a mature-market dashboard onto it.
Conclusion: The Core of Two-Sided Marketplace Analysis Is Watching Two Reports at Once
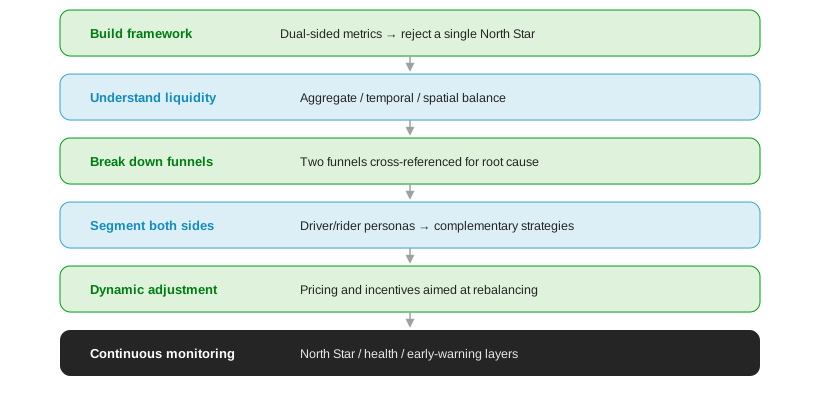
The most common mistake in two-sided marketplace analytics is reducing it to two independent single-sided problems solved separately. The real value lies in understanding the causal chain and feedback loop between the two sides — driver earnings affect supply, supply affects wait time, wait time affects rider retention, rider retention affects order volume, and order volume feeds back into driver earnings. It's a loop, not two lines, and any analytical framework that fails to close that loop is only treating symptoms, not actually understanding the marketplace.